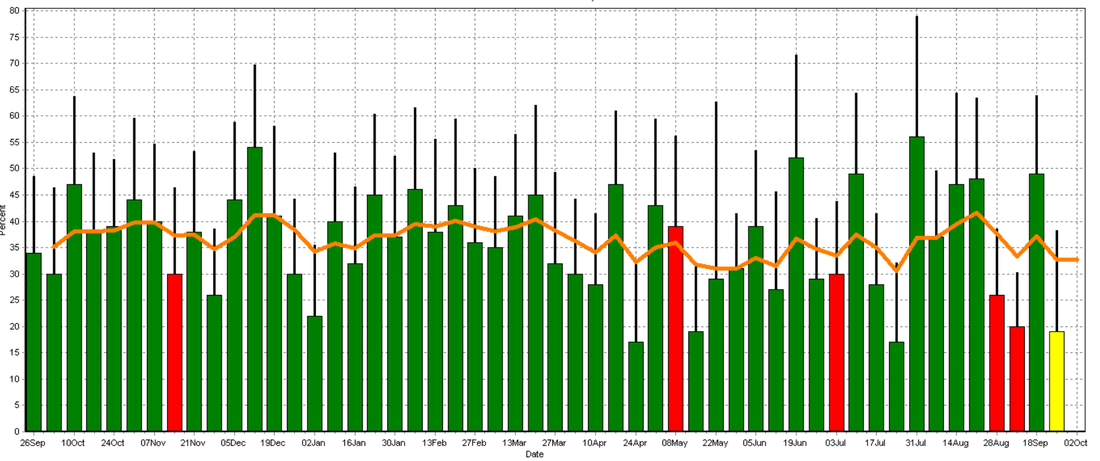
Graphs are a great way to interpret information. Bredsum, as discussed in a previous tip, shows multiple aspects of your breeding program. To view your weekly conception rate type “BREDSUM\R” into the command line and a bar graph will appear. Green represents a normal or expected weekly conception rate. If there is are a significant number of cows re-bred 21 days after their previous breeding then conception rate is less than expected and a red bar will appear. Two other colors are possible. If more than 10% of that week’s breedings do not have a known outcome (pregnant or open) a yellow bar will be displayed for the week and a pink bar points out that 10% of the animals bred during that week were bred within a 2 day period. Check out this graph to see if there are any trends with your conception rate throughout the past year.

|
|
