Minnesota Dairy Herd Improvement Association
Like Minnesota DHIA on Facebook
(763) 682 -1091
  • Home
  • 2019 Annual Summary
  • Contact Information
  • Members Message
  • Centre Labs
  • Service Options
    • Milk Pregnancy Tests
    • Cowside Tests
    • DNA Mastitis Testing
    • Johne's Testing
    • Leukosis & BVD
    • Ear Tags
    • MUN Testing
    • Cows For Sale
  • Management Tools
    • Herd Summary
    • SCC Tools >
      • Herd Analysis Worksheet
      • Tutorial Reports
    • Scorecard
    • Impact of Management - Changes Worksheet
    • Yardstick
    • Interpreting Mastitis Culturing Results
    • Featured Articles
    • Bio Security
    • Newsletters
    • Links
  • Software
    • Software Tips: Thirsting for Knowledge Thursdays
    • El Software consejos en Español
    • Educational Tutorials
    • Dairy Comp 305
    • Scout
    • PCDART
    • Updates
    • Newsletters >
      • Dairy Comp 305
      • Scout
  • Web Reports
    • How to Login to Web Reports
    • Login
  • Scholarship
    • The Big Book of Moo
    • DHIA
  • News
  • Careers
    • Open Positions & Applicaton

Software Tip #25 Date Range for Conception Rate Graph

11/19/2015

0 Comments

 
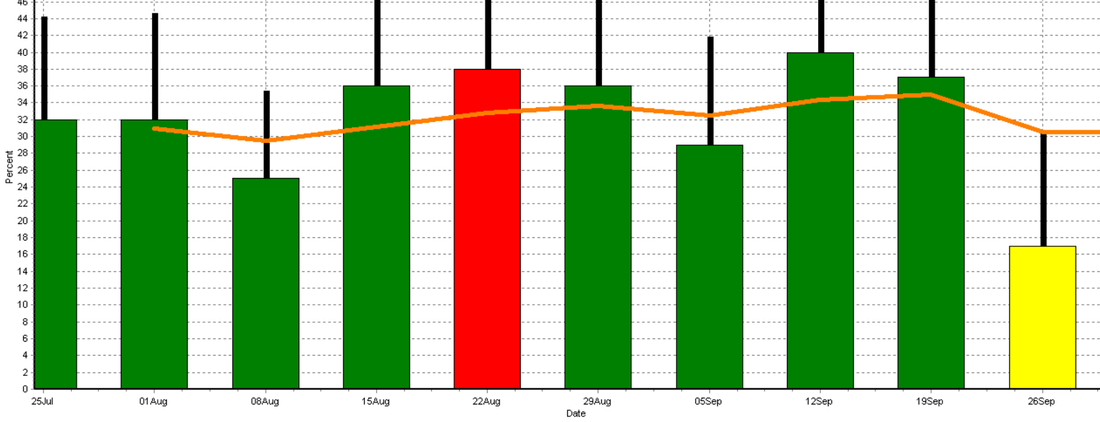
To follow up with last week’s tip on the weekly conception rate graph there are additions to the command to narrow or expand the date range of the graph. There are 2 ways the conception rate graph can be altered to show any range of dates. The first is by typing BREDSUM\RD. The D brings up a calendar where you will select the range of dates. Another option would be to have a graph showing a specific number of days in the past. If you put a number after the D it will display a graph for that many days ago; for example, BREDSUM\RD100 will give a conception rate graph for the last 100 days.
Picture
0 Comments


Leave a Reply.

    RSS Feed